Afrofuturist and Researcher
Pipeline
The Civil Rights Data Collection has reported that African American students are 3.5 times more likely to be suspended than their white peers. These statistics illustrate the complexities and inequalities in the justice system. Developed a replayable simulation of the school to prison pipeline that demonstrates punishment differences among African American and White students in the public school system.
Duration: 2 months, Completed May 2017
Key Contributions: User Research, UX Design, Programming
Tools: research, sketching, wireframing, mock-up, programming(Javascript), illustration
Motivations for Project
-
Represents a complex system that is unequal in the treatment of people of color
-
Recent incidents on Police Brutality
-
Replaying this model of the system, allow individuals to have a better understanding of inequalities
-
School disciplinary policies disproportionately affect black students
Comparative Analysis


In designing the simulation it was important to understand if there were other existing tools available that allowed individuals to experience or see the treatment differences among African Americans and other racial groups. I conducted a comparative analysis of the following simulations:
-
One Dark Night(Nonny de la Pena): VR that explores the night of the Travon Martin case.
-
ACLU's School to Prison Pipeline: A online simulation that asks you to answer a series of questions to see if you can navigate the system.
-
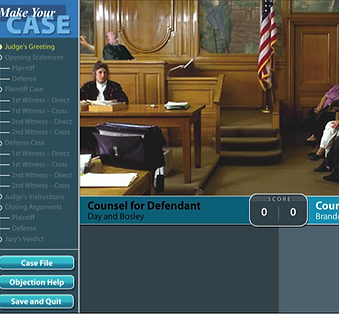
Make Your Case: a simulation that asks the user to defend themselves in court.
Based on my exploration and research of the tools I realized there are five components that are essential in developing a simulation that tackles this subject matter: audio, immediate feedback from simulation, interactor has agency, clearly defined end states and player designed character.

Based on the comparative analysis the following flowchart was created to show how the simulation would operate. This chart was then used to develop sketches and mockup of the prototype.
Sketches
After developing the flowchart for how the simulation should be structured. This information led to creating a series of sketches that showed how the information would be displayed. It was important to lay out the information in a way that could challenge these issues, open conversations, and present people with adequate resources.

This was the first layout for the flow of the first 3 pages. One major goal was to have resources: news articles, documentaries, etc. Throughout page, for people to learn more information or understand what helped in framing topic.

The last two sections were helpful in predicting the ultimate outcome of the page. From deciding to pay bail or just wait in jail. To even selecting a lawyer. These situations were different for each character based on race.


